
SYNERGISTIC SUPPLEMENTATION, BIOENERGETICS AND ADVICE

Synergistic Supplementation, bioenergetics and advice
What is
Bioresonance?
Bioresonance is a non invasive therapy and bioenergetic analysis tool for health practitioners
What is
Bioresonance?
Bioresonance is a non invasive therapy and bioenergetic analysis tool for health practitioners
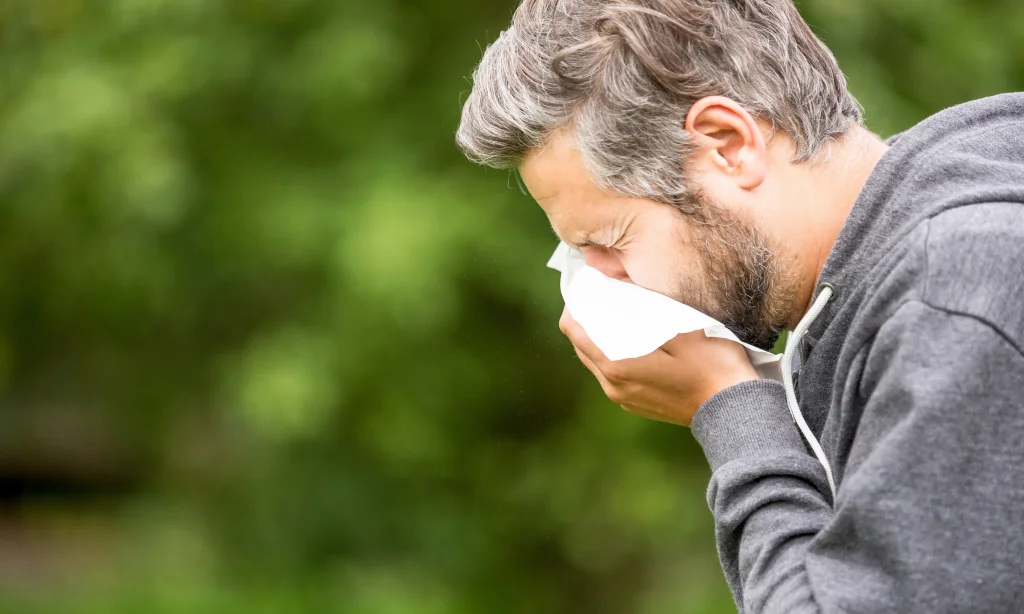
ALLERGIES
WEIGHT LOSS
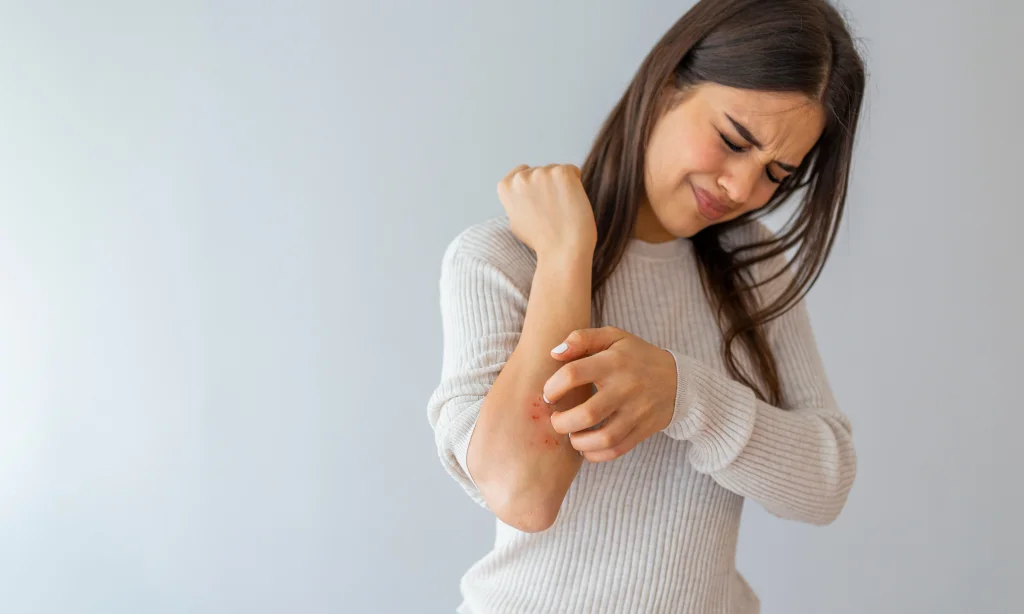
SKIN CONDITIONS

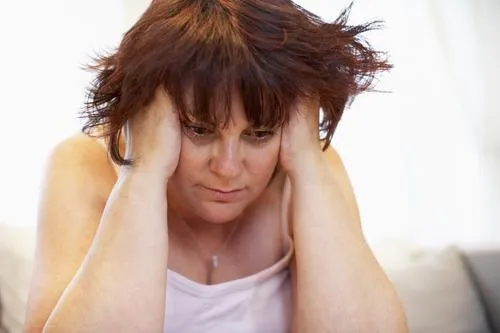
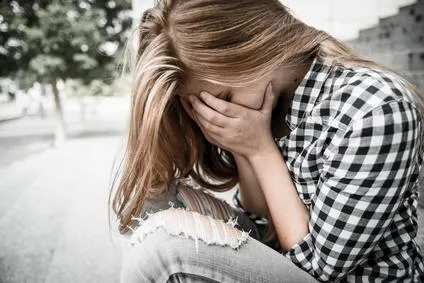
SERIOUS ILLNESS
INTESTINAL DISORDERS
PARASITES
Chris Russell
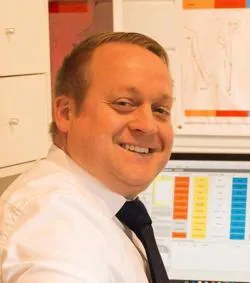
Chris Russell is a distinguished Bicom bioresonance therapist and a cornerstone of the Reson8 clinic in Leeds. Since starting his career in bioresonance in 2015, Chris has dedicated himself to mastering the nuances of this innovative therapy. His commitment to excellence is evident from his annual attendance at the International Congress in Germany and his achievement of nearly all manufacturer-approved certifications available. Chris's clinic walls, adorned with numerous accreditations, stand as a testament to his expertise and dedication.
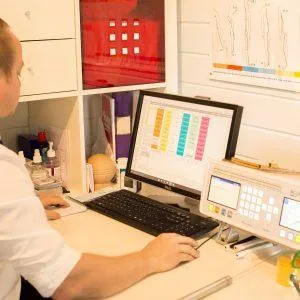
Known for his meticulous attention to detail and profound care for his patients, Chris has built an international reputation that extends beyond borders. His expertise is so revered that he has been chosen by several international Regumed representatives to train their therapists, further cementing his status as a leader in the field.
At Reson8, Chris provides face-to-face therapy sessions, tackling a wide array of conditions ranging from mental health and allergies to specialised therapies like highly effective quit smoking programs, which boast a near-perfect success rate. While he primarily works out of Leeds, the global demand for his skills means that most of his therapies are now delivered remotely.
For those seeking further validation of Chris’s effectiveness and success with the Bicom Optima and Bicom Body Check systems, a visit the reviews page reveals a multitude of positive reviews and testimonials from satisfied clients worldwide.
BOOK A PERSONAL CONSULTATION WITH CHRIS
CLICK THE IMAGE TO ORDER
The Initial Consultation is required if you have not visited the clinic in over 12 months or if it is your first time.
The session is a normal 60 minute therapy where you will be next to our therapist and advise will be provided on various modalities.
More information is on the product page and to see if this will work for you then please look at our reviews.

CANNOT TRAVEL TO US? BOOK A REMOTE SESSION
CLICK THE IMAGE TO ORDER
The Initial Consultation is required if you have not visited the clinic in over 12 months or if it is your first time.
The session is a normal 60 minute therapy where you will be next to the therapist and advise will be provided on various modalities.
More information is on the product page and to see if this will work for you then please look at our reviews.
Want to know more about Bioresonance Therapy?
Unlock the secrets of bioresonance therapy and energetic diagnosis with this FREE 160-page ebook! Written over 30 years ago, this timeless guide is packed with proven information that has stood the test of time. Discover how bioresonance therapy can help you restore your body’s own frequencies and promote natural healing. Don’t miss out on this must-read resource for anyone interested in holistic health. Get your FREE copy today and discover the power of bioresonance therapy!
Enter your email to receive

Free zoom or phone consultation to discuss your condition

Free ebook on bioresonance therapy.

Free 60min therapy session after scan

Free access to our community with secure forum
You no longer need to visit the clinic to benefit from the therapy or to have a test conducted. We need to be able to deliver test kit to you and you will need to be able to return the sample. International orders have increased postal costs added. We will also deliver the corrective frequency disk via the post after each therapy session.
You no longer need to visit the clinic to benefit from the therapy or to have a test conducted. We need to be able to deliver test kit to you and you will need to be able to return the sample. International orders have increased postal costs added. We will also deliver the corrective frequency disk via the post after each therapy session.
You no longer need to visit the clinic to benefit from the therapy or to have a test conducted. We need to be able to deliver test kit to you and you will need to be able to return the sample. International orders have increased postal costs added. We will also deliver the corrective frequency disk via the post after each therapy session.
Bioresonance is a very gentle therapy but you may feel tired afterwards. We check your energy level at each session. Therapy involves a basic therapy followed by scar and geopathic stress and we always treat the elimination organs, lymph, liver and kidneys. The final therapy is based on the initial test results.
If you would like to learn more then we can recommend some sites, as complementary therapy is usually restricted in what it can claim its difficult to find information. An independent site on bioresonance is bioresonancetherapy.com
Here you will find many pages of research including therapy studies on many conditions.
WHY US
Why choose a Bicom therapist?
Bicom Bioresonance machines are known within the industry to be the leading therapy device. Any therapist on this site will have a Bicom Optima or 2000 and will have regular training and have to conform to very high standards of patient care.
WHO WE ARE
Part of a 19,000 strong network
Reson8 are part of a global organisation of bicom bioresonance therapists consisting of doctors, dentists, veterinary surgeons, naturopaths and private therapists. We share best practice and white papers covering all modalities to bring you the best treatment.
WHAT WE DO
Why choose a Bicom therapist?
Bicom Bioresonance machines are known within the industry to be the leading therapy device. Any therapist on this site will have a Bicom Optima or 2000 and will have regular training and have to conform to very high standards of patient care.
Part of a 19,000 strong network
are part of a global organisation of bicom bioresonance therapists consisting of doctors, dentists, veterinary surgeons, naturopaths and private therapists. We share best practice and white papers covering all modalities to bring you the best treatment.
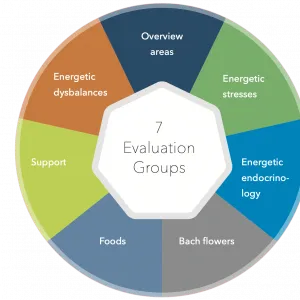
Bioenergetic analysis
We offer a number of options for a wide range of conditions. Our advice involves an holistic approach rather than just targeting a symptom, our aim is not to suppress or mask a symptom but remove the cause through nutrition, bioresonance and other modalities.

We have been searching for a cure for my daughter's Asthma condition for many years and decided to try alternative medicines. We were skeptical at the beginning to use bioresonance but were amazed at the results. After only 3 weeks we saw a near total recovery. I truly recommend this treatment.
Joseph M
At first I was skeptical ... But can honestly say after a couple of sessions when I started to notice my issues improving, along with an understanding of the 'treatment'. I would highly recommend Bioresonance to anyone . Especially those who have been told there is no further treatment available. There is!!
Lindsay W
We have been searching for a cure for my daughter's Asthma condition for many years and decided to try alternative medicines. We were skeptical at the beginning to use bioresonance but were amazed at the results. After only 3 weeks we saw a near total recovery. I truly recommend this treatment.
Joseph M